

ARCHIVE
Vol. 3, No. 2
JULY, 2013-JANUARY, 2014
Research Articles
Research Notes and Statistics
Special Essay
Book Reviews
Changes
in the Distribution of
Operational Landholdings in Rural India:
A Study of National Sample Survey Data
Vikas Rawal*
*Centre
for Economic Studies and Planning, Jawaharlal Nehru University, New Delhi;
and Economic and Social Development Department, Food and Agriculture Organisation
of the United Nations, Rome, vikasrawal@gmail.com.
Abstract: This paper analyses National Sample survey data on changes in the distribution of operational holdings of land, using data from NSS surveys on employment and unemployment. The paper discusses the limitations of these statistics in some detail. Four main points emerge from the analysis: there has been a sharp rise in landlessness in rural India; caste disparities in access to land have persisted over time; there has been a rise in inequality in distribution of land cultivated by households; and there has been a decline in the proportion of manual labour households that combined wage labour with cultivation of small holdings. Finally, statistics on land distribution at the State level reveal some puzzling features – some of which point to possible errors in data collection.
Keywords: land, landlessness, operational holdings, National Sample Survey, India.
Introduction
There have been major changes in the structure of India’s agrarian economy over the last two decades. In this context, the need to analyse changes in the structure of land distribution cannot be overemphasised. Analytical study of these changes has however been seriously constrained by the lack of accurate and regularly available data on landholdings. This paper examines the data on landholdings in the National Sample Survey Organisation’s (NSSO’s) Surveys of Employment and Unemployment. The paper discusses in detail the problems and limitations of these data, and summarises the main conclusions that can be reliably drawn from them.
The NSSO’s large quinquennial surveys of consumer expenditure and employment–unemployment collect information from respondent households about the extent of land they own, the extent of land they possess (through ownership, leasing or mortgaging), and the extent of land they cultivate. What makes these statistics interesting is that they are collected systematically in the same format every five years, except for one change that was introduced in 2004–05.
Analysis of these data suggests that there has been a sharp increase in the proportion of rural households that do not cultivate any land, and a distinct rise in levels of inequality in the distribution of operational holdings. While the all-India findings broadly correspond to other studies based on village-level evidence, State-level estimates in the NSS surveys reveal some puzzling features – some of which point to possible errors in data collection.
Limitations of Available Data on Landholdings
Available statistics on landholdings in India are very poor in terms of detail, accuracy, and regularity. Critical evaluations of these statistics have pointed to serious limitations (see, for example, Bakshi 2008; Cain 1983; Ramachandran 1980; and Rawal 2008). Since such analyses already exist, these issues are not comprehensively discussed in this paper.
The two most commonly used sources of official data on landholdings in India are the NSS Surveys of Land and Livestock Holdings and the Agricultural Censuses. In the Surveys of Land and Livestock Holdings, which are conducted by the NSSO every ten years, detailed information is collected on various aspects of land and livestock holdings, including plot-wise data on land use and tenurial status. There are two major limitations of these surveys. First, they are conducted only once in ten years. The last survey was conducted in 2002–03 and nothing more recent is available. Secondly, they collect data on all types of land including homesteads, and the published NSSO reports do not distinguish between these. As Cain (1983) and Rawal (2008) have pointed out, this gives rise to enormous confusion in estimating the extent of landlessness and inequality in land distribution. Cain (1983) has noted that the
change and ambiguity in important concepts and definitions and inconsistency and incompleteness in published tabulations prevent confident estimation of the percentage of landless households at different points in time. Far from being able to discern the rate of change in landlessness, we find that the direction of change remains uncertain.
Availability of household-level data from the survey’s 48th round made it possible to separate the different types of land. However, only two survey rounds have been conducted since then. Also, as Rawal (2008) has pointed out, the data from these two rounds are not strictly comparable because of a change in the way data on cultivation of homestead lands were recorded.
The Agricultural Censuses are fraught with inaccuracies and gaps. First, they do not provide information on ownership holdings and deal only with operational holdings of land. Secondly, they do not cover landless households and therefore provide no information about the extent of landlessness, providing an incomplete picture of land distribution. Thirdly, in a majority of the States, the Agricultural Censuses are based on retabulations of land records. Land records are not only plagued by benami registrations, but are also often not updated when ownership of land is transferred through sale, inheritance, or partitioning. Further, land records are usually individual-based and do not identify households. The method that is adopted to transform this individual owner/cultivator-level information into household-level information is not clearly stated, if at all this is done. Finally, in some States – Kerala, West Bengal, Orissa, Goa, Sikkim, Meghalaya, Manipur, Mizoram, Nagaland, Tripura and Arunachal Pradesh – the Agricultural Censuses are not censuses of holdings at all, but are based on sample surveys. All these problems render the data of Agricultural Censuses practically useless for analysing the extent of landlessness and distribution of landholdings.
This paper uses data from a third source, NSS Surveys of Employment and Unemployment, to study changes in the distribution of operational holdings in India. Although the NSSO’s quinquennial surveys of Consumer Expenditure and Employment and Unemployment collect limited information on the landholdings of households, since this information is collected systematically in all the rounds of the surveys, they provide us with a somewhat consistent database to analyse changes in land distribution. Household-level data from six rounds of these NSS surveys – the 43rd round (1987–88), 50th round (1993–94), 55th round (1999–2000), 61st round (2004–05), 66th round (2009–10), and 68th round (2011–12) – are used in this paper. Although not a quinquennial round, a large sample survey of employment and unemployment was conducted out of turn by the NSSO as part of the 68th round.
Before presenting the results of the analysis, it would be useful to discuss some features and limitations of this dataset.
There are three items of data in schedule 10 (on employment and unemployment) of the surveys that are of interest to us.1 These pertain to:
- land owned by households,
- land possessed by households, and
- land cultivated by households.
Conceptually, the data on land owned correspond to ownership holding of land, and the data on land possessed correspond to operational holding of land. However, in the NSS surveys, these data deal with not just agricultural land but with all types of land, including homesteads. Aggregation of the physical extent of plots of land that are very dissimilar in terms of their use, their productive potential, and their market value makes these variables unusable.2
On the other hand, the data on land cultivated in the surveys pertain to agricultural land only, and correspond to net sown area. Strictly speaking, land cultivated is different from operational holding of land as it does not include land that is left fallow. However, since the extent of agricultural land that is left fallow for a whole year or longer is relatively small in most States, I believe that in the NSS surveys, the extent of land cultivated by a household provides a close approximation to the size of operational holding of the household.
There are three other important limitations of this dataset that need to be mentioned. First, like all sources of data on landholdings, there is considerable under-reporting of land held by households, in particular of households that own large amounts of land. An implication of this under-reporting of land, particularly of large landowners and lessors of land, is that the estimates of total land cultivated from the NSS Surveys of Employment and Unemployment account for only about 70 per cent of net sown area at the national level. Table 1 shows that the gap between the estimates of cultivated area from the NSS surveys and the statistics on land use has tended to be particularly high in the recent surveys. State-level estimates of total land cultivated reveal considerable variations in the gap between estimates from NSS data and official statistics on land use. Appendix Table B1 shows that the gap is particularly high in some States (for example, Gujarat and Karnataka), and relatively low in others (for example, Rajasthan and Madhya Pradesh).
It may be noted that the gap between estimates of total operated area from the NSS Surveys of Land and Livestock Holdings, which collect much more detailed information on land, and of net sown area from the land use statistics, is smaller than the gap between estimates of cultivated area from the NSS Surveys of Employment and Unemployment and of net sown area from the land use statistics. This could be because more detailed data collection helps in obtaining more accurate data. However, even in the case of the Surveys of Land and Livestock Holdings, the gap remains substantial. For 1991–92, the estimate of total operational holdings in the Land and Livestock survey accounted for about 93 per cent of net sown area. This fell to about 85 per cent in the 2002–03 Survey of Land and Livestock Holdings.
In the context of under-reporting of land, it may also be noted that since the extent of under-reporting is supposed to be large for large landholdings, these data are likely to underestimate inequalities in ownership and operational holding of land.
Secondly, like all official sources of data on landholdings in India, the NSS Surveys of Employment and Unemployment also capture very little of incidence of tenancy. Given that most of the States of India have legislation under which leasing of agricultural land is prohibited or regulated, most tenancy contracts in rural India are informal and oral. Incidence of such tenancy is concealed, and does not appear either in official records or in official surveys. This problem affects the NSS surveys just as it affects all other sources of data on land.
Thirdly, an inconspicuous but important change has been introduced since 2004–05 in questions pertaining to land in schedule 1.0 and schedule 10 of the NSS surveys. Until 1999–2000, the NSS schedules were designed to record information on extent of land up to two decimal places. As a result, the smallest landholding recorded was 0.01 hectare, and any household with land less than 0.01 hectare was treated as landless. In all the tabulations of the NSSO’s reports as well, the smallest land size was 0.01 hectare and households with less than 0.01 hectare were treated as landless. In the 61st round (2004–05) of the NSS survey, a small but important change was introduced in the schedules: schedule 1.0 and schedule 10 started recording data pertaining to land owned, land possessed, and land cultivated, up to three decimal places. As a result, the smallest size of holding that was recorded became 0.001 hectare. Correspondingly, from 2004–05, NSSO reports started to classify households having land between 0.001 hectare and 0.01 hectare as owning/possessing/cultivating land, and only households having less than 0.001 hectare of land as landless.
| Year |
Estimate of total area
cultivated (NSS surveys) as a proportion of net sown area (land use statistics) |
| 1987–88 | 86.9 |
| 1993–94 | 77.6 |
| 1999–2000 | 70.6 |
| 2004–05 | 74.4 |
| 2009–10 | 71.1 |
| 2011–12 | 71.7 |
Sources: Estimates of total area cultivated are based on unit-level data from different rounds of NSS Surveys of Employment and Unemployment. Data on net sown area are taken from Agricultural Statistics at a Glance, Directorate of Economics and Statistics, Ministry of Agriculture, Government of India.
This change resulted in a huge drop in the proportion of landless households in the estimates based on these surveys. The effect was particularly significant in estimates of landlessness in terms of ownership or possession of land because these variables included homestead land. As a result of this change, households having only tiny homesteads got classified as landowning households. Table 2 shows that this resulted in lowering the proportion of households that did not own any land by about 20 percentage points, and the proportion of households that did not possess any land by about 23 percentage points, in all the NSS survey rounds since 2004–05.
Unless accounted for, this change makes the data from NSS surveys prior to the 61st round incomparable with data from the 61st round and thereafter. In this paper, I have corrected this problem by treating all households having less than 0.01 hectare of land as landless. With this correction, estimates from the 61st and 66th rounds become comparable with estimates from earlier rounds of NSS surveys.
Table 2 Proportions of households that did not own land, possess land, and cultivate land, rural India, 1987–88 to 2011–12 in per cent
| Variable | Estimate | 2004–05 | 2009–10 | 2011–12 |
| Not owning land | Uncorrected/Official | 7 | 5 | 6 |
| Corrected | 25 | 26 | 26 | |
| Not possessing land | Uncorrected/Official | 2 | 8 | 3 |
| Corrected | 25 | 30 | 26 | |
| Not cultivating land | Uncorrected/Official | 43 | 45 | 47 |
| Corrected | 43 | 47 | 49 |
Note: The corrected estimates treat all landholdings less than 0.01 hectare as zero, to make the estimates consistent with the previous rounds. Uncorrected estimates for the 61st round match exactly with published estimates in NSSO’s Report Number 515. Similarly, uncorrected estimates from the 66th round match exactly with published estimates in NSSO’s Report Number 537. The NSSO has published estimates of only key indicators from the 68th round so far. These do not include data on land.
Source: Based on unit-level data from different rounds of NSS Surveys of Employment and Unemployment.
Landlessness
As per the latest NSS data for 2011–12, about 49 per cent of households did not cultivate any land. Data from successive rounds of NSS surveys show a sharp rise in landlessness over the last two decades. Data on land cultivated show that the proportion of households that did not cultivate any land increased from 35 per cent in 1987–88 to 49 per cent in 2011–12 (Table 3).
NSS data clearly show that the increase in landlessness took place across all caste and social groups. Table 4 shows that 62 per cent of Dalit households, 39 per cent of Adivasi households, and 60 per cent of Muslim households in rural India did not cultivate any land in 2011–12. Between 1987–88 and 2011–12, the proportion of households that did not cultivate any land increased by 20 percentage points among Muslims, 11 percentage points among Dalits, 11 percentage points among Adivasis, and 12 percentage points among Other households.
Table 3 Proportions of households that did not cultivate any land, rural India, 1987–88 to 2011–12 in per cent
| Year | Households that did not cultivate any land |
| 1987–88 | 35 |
| 1993–94 | 39 |
| 1999–2000 | 41 |
| 2004–05 | 43 |
| 2009–10 | 47 |
| 2011–12 | 49 |
Source: Based on unit-level data from different rounds of NSS Surveys of Employment and Unemployment.
Table 4 Proportions of households that did not cultivate any land, by social group, rural India, 1987–88 to 2011–12 in per cent
| Year | Dalit | Adivasi | Muslim | Other |
| 1987–88 | 51 | 28 | 40 | 31 |
| 1993–94 | 53 | 30 | 49 | 34 |
| 1999–2000 | 56 | 32 | 51 | 35 |
| 2004–05 | 58 | 34 | 52 | 38 |
| 2009–10 | 61 | 39 | 58 | 41 |
| 2011–12 | 62 | 39 | 60 | 43 |
Source: Based on unit-level data from different rounds of NSS Surveys of Employment and Unemployment.
While these are the overall national trends, State-level data show some puzzling patterns. Table 5 and Figure 1 present State-level estimates of proportions of households that did not operate any land. Table 5 shows that about 79 per cent of households in Tamil Nadu did not operate any land. The corresponding proportion was 73.5 per cent in Punjab, 65 per cent in West Bengal, and 61.2 per cent in Andhra Pradesh. These estimates, particularly for Tamil Nadu and West Bengal, seem to be much higher than anything that has been recorded even in primary data-based studies. Existing evidence from other sources – both primary data-based academic studies and the experience of activists of peasant organisations from the two States – does not support the estimates of extent of landlessness provided by NSS data for Tamil Nadu and West Bengal. The fact that NSS data in more than one recent round have consistently shown very high levels of landlessness in these two States calls for further independent investigation.
Table 5 Proportions of households that did not cultivate any land, by State, rural India, 1987–88 to 2011–12
| State | 1987–88 | 1993–94 | 1999–2000 | 2004–05 | 2009–10 | 2011–12 |
| Andhra Pradesh | 45.9 | 49.5 | 52.3 | 60.9 | 66.2 | 61.2 |
| Assam | 31.2 | 29.4 | 35.6 | 25.8 | 27.1 | 38.3 |
| Bihar (undivided) | 34.7 | 37.5 | 41.5 | 41.8 | 48.7 | 45.7 |
| Madhya Pradesh (undivided) | 25.8 | 24.9 | 27.4 | 31.6 | 32.5 | 38.3 |
| Goa | – | 60.4 | 68.8 | 72.9 | 67.7 | 95.3 |
| Gujarat | 47.2 | 46.3 | 42.8 | 51.6 | 44.8 | 52.7 |
| Haryana | 45.6 | 51.5 | 48.8 | 59.4 | 59.9 | 60.4 |
| Himachal Pradesh | 11.4 | 13.3 | 17.4 | 19.6 | 17.8 | 21.3 |
| Jammu & Kashmir | 14 | 16.2 | 13.3 | 10.6 | 15.9 | 22.7 |
| Karnataka | 40 | 38.3 | 42.2 | 46.4 | 53.4 | 47.9 |
| Kerala | 19.6 | 69.4 | 36.1 | 40.4 | 45.6 | 52.7 |
| Maharashtra | 39.1 | 43 | 42.8 | 48.3 | 47.6 | 49.7 |
| Manipur | 16.2 | 22.1 | 34.3 | 17.2 | 25.8 | 29.8 |
| Meghalaya | 18.4 | 17.2 | 12.4 | 16 | 36.6 | 26.4 |
| Mizoram | 17.2 | 5 | 14.4 | 12.8 | 22 | 24.2 |
| Nagaland | – | 4.4 | 10.5 | 8.9 | 14 | 8.1 |
| Orissa | 35.7 | 35.4 | 38.4 | 41.8 | 38.2 | 40.5 |
| Punjab | 57.1 | 61.5 | 61.2 | 68.3 | 68.2 | 73.5 |
| Rajasthan | 21.9 | 18.9 | 21.8 | 26.3 | 30.4 | 29.4 |
| Sikkim | 15 | 32.2 | 35.1 | 44.2 | 41.9 | 22.2 |
| Tamil Nadu | 57.1 | 63.4 | 67 | 72 | 77.4 | 78.9 |
| Tripura | 58.7 | 52.1 | 57.8 | 54.6 | 63.3 | 62.2 |
| Uttar Pradesh (undivided) | 22.7 | 22.9 | 26 | 28.8 | 33 | 35 |
| West Bengal | 39.6 | 41.6 | 48.1 | 47.8 | 62.2 | 65 |
| India | 35.4 | 38.7 | 40.9 | 43.4 | 47.1 | 48.5 |
Source: Based on unit-level data from different rounds of NSS Surveys of Employment and Unemployment.
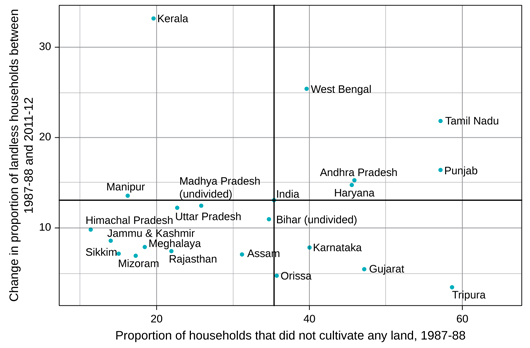
Figure 1 Level and change in proportion of households that did not cultivate any land, by State, rural India, 1987–88 to 2011–12
Distribution of Operational Holdings
This section analyses all-India trends in respect of distribution of land cultivated by households. One problem of looking at the all-India distribution of operational holdings is that measurement of such distribution requires comparing physical extents of land that are of different quality, productive potential, and market value. This becomes particularly problematic given a very high degree of heterogeneity across different regions in respect of quality and productive potential of land. The method used here to resolve this problem is elaborated in Appendix A.
Table 6 shows the shares of land cultivated by different deciles of households. The table shows that, in 2011–12, the top decile of households cultivated more than half of the total land cultivated. Between 1987–88 and 2011–12, the share of land cultivated by the top 10 per cent of households increased by about two percentage points. In contrast, in 2011–12, the bottom half of households cultivated only 0.4 per cent of total land. The shares of the bottom six deciles in total cultivated land declined consistently over this period.
Figure 2 shows the Lorenz curves of distribution of land cultivated by households. Table 7 shows the Gini coefficients based on these Lorenz curves. The table shows that the Gini coefficient of distribution of land cultivated increased by about four percentage points between 1987–88 and 2011–12.
There are sharp disparities in access to land across different caste and religious groups. These disparities have been persistent over time. Table 8 shows the share of different social groups in total land under cultivation and in total number of households. The table shows that the share of Dalit and Muslim households in total land under cultivation was much lower than their share in total number of households, and that this disparity has not declined over time. In 2011–12, Dalit households accounted for 21 per cent of rural households but cultivated only 9 per cent of land; Muslims accounted for 11 per cent of rural households but cultivated only 6 per cent of land.
State-level data on the distribution of holdings are presented in Appendices C and D. Appendix Table C1 provides proportions of land cultivated by different quintiles of households. Appendix Tables D1 and D2 show the distribution across different size-classes of cultivated land.
Table 6 Distribution of land cultivated by households across deciles of households, rural India, 1987–88 to 2011–12 in per cent
| Deciles of households | 1987–88 | 1993–94 | 1999–2000 | 2004–05 | 2009–10 | 2011–12 |
| D1 | 0 | 0 | 0 | 0 | 0 | 0 |
| D2 | 0 | 0 | 0 | 0 | 0 | 0 |
| D3 | 0 | 0 | 0 | 0 | 0 | 0 |
| D4 | 0.7 | 0.2 | 0 | 0 | 0 | 0 |
| D5 | 3.4 | 3.6 | 2.7 | 1.9 | 0.8 | 0.4 |
| D6 | 5.8 | 6.1 | 5.7 | 5.5 | 5.2 | 5 |
| D7 | 8.6 | 9 | 8.6 | 9.1 | 9.4 | 9.2 |
| D8 | 12.8 | 13.1 | 13 | 13.5 | 13.3 | 13.7 |
| D9 | 19.9 | 20.1 | 20.4 | 21.1 | 21 | 21.6 |
| D10 | 48.6 | 47.9 | 49.6 | 48.9 | 50.3 | 50.2 |
Source: Based on unit-level data from different rounds of NSS Surveys of Employment and Unemployment.
Table 7 Gini coefficient of land cultivated by households, based on pooled and normalised data, India, 1987–88 to 2011–12
| Year | Gini based on pooled data | Gini based on regionally ranked data |
| 1987–88 | 0.7365 | 0.6850 |
| 1993–94 | 0.7397 | 0.6835 |
| 1999–2000 | 0.7570 | 0.7013 |
| 2004–05 | 0.7521 | 0.7034 |
| 2009–10 | 0.7768 | 0.7171 |
| 2011–12 | 0.7797 | 0.7204 |
Source: Based on unit-level data from different rounds of NSS Surveys of Employment and Unemployment.
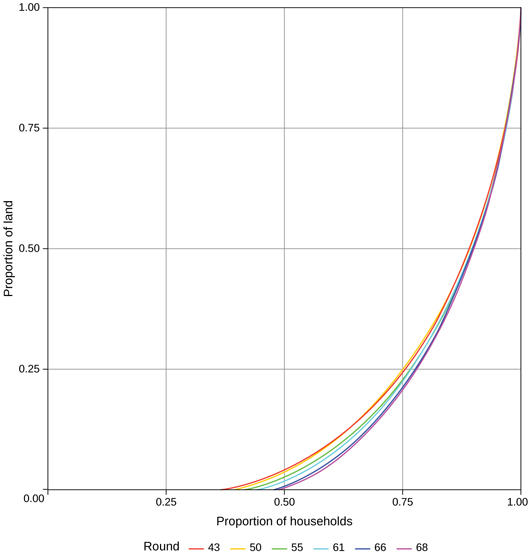
Figure 2 Normalised Lorenz curves for distribution of land cultivated by households, rural India, 1987–88 to 2011–12
Table 8 Shares of different social groups in total land under cultivation and in total number of households (in parentheses), rural India, 1987–88 to 2011–12
| Year | Dalit | Adivasi | Muslim | Other |
| 1987–88 | 8 (20) | 12 (11) | 6 (9) | 74 (60) |
| 1993–94 | 10 (21) | 12 (11) | 5 (9) | 73 (59) |
| 1999–2000 | 10 (22) | 12 (11) | 5 (10) | 73 (57) |
| 2004–05 | 10 (22) | 12 (11) | 6 (10) | 73 (57) |
| 2009–10 | 10 (22) | 12 (11) | 5 (10) | 73 (57) |
| 2011–12 | 9 (21) | 13 (11) | 6 (11) | 72 (57) |
Source: Based on unit-level data from different rounds of NSS Surveys of Employment and Unemployment.
Primary Occupations of Households
NSS surveys classify households by primary source of income. There are serious problems with this classification as the NSSO does not have a rigorous method for identifying the most important source of income of a household, and this is done in an ad-hoc manner. In the 2011–12 NSS survey, the classification scheme has also been changed, with agricultural and non-agricultural labour households now referring only to casual workers (see Rawal 2013, for a detailed discussion on this).
Table 9 shows that there has been a fairly clear decline in the proportion of households that primarily depend on agricultural labour, while the proportion of households that depend primarily on non-agricultural manual labour has been on the rise.3
It may be noted that while there has been a clear tendency of rising landlessness (Table 3), the proportion of households that are primarily dependent on self-employment in agriculture has not declined correspondingly (Table 9). The NSS data show that increase in landlessness has primarily happened within households that are mainly dependent on manual wage labour. That is, a substantial proportion of manual labour households that used to combine manual wage labour with self-cultivation on very small holdings are now exclusively dependent on manual wage labour. Table 10 shows that there has been a particularly steep decline in the proportion of agricultural labour households that also cultivated some land, while the proportion of non-cultivating households among manual workers has been on the rise.
Table 11 shows the proportions of non-cultivating households in different types of primary occupations. The table shows that the proportion of landless (that is, non-cultivating) households that were primarily dependent on agricultural labour has declined considerably over the last four rounds of the NSS survey, while the proportion of landless households primarily dependent on non-agricultural labour has risen. Of non-cultivating households, 45 per cent were primarily dependent on agricultural labour in 1999–2000; this proportion fell to only about 30 per cent in 2011–12.4
Table 9 Proportions of households whose primary occupation was agricultural labour, non-agricultural labour, and self-employment in agriculture, rural India, 1987–88 to 2011–12 in per cent
| Year | Agricultural labour | Non-agricultural labour | Self-employed in agriculture |
| 1987–88 | 30.7 | 9 | 37.7 |
| 1993–94 | 30.3 | 8 | 37.8 |
| 1999–2000 | 32.2 | 8 | 32.7 |
| 2004–05 | 25.8 | 10.9 | 35.9 |
| 2009–10 | 25.6 | 14.8 | 31.9 |
| 2011–12 | 21 | 13.5 | 34.3 |
Source: Based on unit-level data from different rounds of NSS Surveys of Employment and Unemployment.
Table 10 Proportions of agricultural labour households and non-agricultural labour households in total rural households, disaggregated by those who cultivated some land and those who cultivated no land, India, 1987–88 to 2011–12 in per cent
| Year | Agricultural labour (also cultivating some land) | Agricultural labour (non-cultivating) | Non-agricultural labour (also cultivating some land) | Non-agricultural labour (non-cultivating) |
| 1987–88 | 14.6 | 16.1 | 4 | 5 |
| 1993–94 | 13.1 | 17.3 | 2.7 | 5.2 |
| 1999–2000 | 13.8 | 18.5 | 2.8 | 5.2 |
| 2004–05 | 9.7 | 16.1 | 3.6 | 7.3 |
| 2009–10 | 8.7 | 16.9 | 4.4 | 10.3 |
| 2011–12 | 6.2 | 14.8 | 4.3 | 9.3 |
Source: Based on unit-level data from different rounds of NSS Surveys of Employment and Unemployment.
Table 11 Proportions of non-cultivating households categorised by primary occupation of the household, by State, 1987–88 to 2011–12 in per cent
| Year | Agricultural labour | Non-agricultural labour | Self-employed (non-agriculture) | Others |
| 1987–88 | 45.6 | 14.2 | 19.4 | 17.9 |
| 1993–94 | 44.6 | 13.5 | 20 | 18.5 |
| 1999–2000 | 45.2 | 12.7 | 20.2 | 19.7 |
| 2004–05 | 37.1 | 16.7 | 22.7 | 20.1 |
| 2009-10 | 35.9 | 21.9 | 20.2 | 18.7 |
| 2011–12 | 30.5 | 19.1 | 21.5 | 24.3 |
Source: Based on unit-level data from different rounds of NSS Surveys of Employment and Unemployment.
Summary and Concluding Remarks
Official statistics on landholdings of rural households in India are very poor. Of the various sources of statistics on landholdings, the NSSO’s household surveys of Employment and Unemployment have the merits of a clearly specified methodological framework and of regular availability of data on a quinquennial basis. However, like the other sources, data from these surveys also suffer from under-reporting of land, particularly by large owners/cultivators. The gap between estimates of total cultivated area in these surveys and net sown area as reported in land use statistics is very large, particularly in some States, and has been increasing.
It is in this context that this paper attempts to analyse the data on landholdings from the NSS surveys. The main findings of the analysis may be summarised as follows.
First, the data show that there has been a sharp rise in the proportion of rural households that did not own any land (agricultural land or any other type of land), and in the proportion of households that did not cultivate any land. According to these data, in 2011–12, about 49 per cent of rural households in India did not cultivate any land.
Secondly, the data show that caste disparities in access to land have persisted over time, and there is no evidence that caste disparities in access to land have tended to weaken over time.
Thirdly, the data show a clear rise in inequality in distribution of land cultivated by households. In 2011–12, the top 10 per cent of households cultivated about 50 per cent of the land. The share of the top decile of households in total cultivated land increased by about 1.6 percentage points between 1987–88 and 2011–12. The Gini coefficient of land cultivated by households in 2011–12 was about 0.72. Between 1987–88 and 2011–12, the Gini coefficient increased by about 3.5 percentage points.
Fourthly, the data on primary occupations of households show that increase in landlessness was associated with a decline in the proportion of manual labour households that combined wage labour with cultivation of small holdings.
Lastly, State-level estimates, presented in the Appendix Tables, show some peculiar features that do not have an obvious explanation. The proportions of non-cultivating households is far too high for some States (for example, Tamil Nadu and West Bengal). Also, in some States (for example, West Bengal), the data show a very large increase in landlessness after 1999–2000. To my knowledge, evidence for such levels of landlessness and such a steep rise in landlessness does not exist in other primary data-based studies.
A natural question that follows from these findings is, what are the factors that explain these changes in the distribution of cultivated land? It is not easy, however, to answer this question, and I do not attempt to deal with it in any detail in this paper. Trends in landlessness and changes in land distribution are influenced by many different factors, including economic differentiation within agriculture, expansion of rural non-farm activities, urbanisation, migration, and demographic changes. All of these are in turn influenced by different national and State-level policies. Economic policies since the 1990s have been associated with a reversal of land reforms, decline in public investment for agriculture, withdrawal of rural banking, and a decline in agricultural incomes. Given this overall thrust of economic policies, it is not surprising that the period was associated with a sharp increase in the proportion of rural households that did not cultivate land and a distinct rise in inequality in distribution of operational holdings.
The data presented in this paper call for a more detailed analysis at the State level and for different points of time. It may be possible to relate the trends and patterns to specific policy changes through more detailed State-level analyses. There is also a possibility that some of these findings come from bad data. Given this, there is also a need to validate these findings using studies based on other sources of large-scale data and on village-level primary data.
Acknowledgements: This paper has benefited from comments by Smita Gupta, Brinda Karat, Surjya Kanta Mishra, R. Ramakumar, Yoshifumi Usami, and two anonymous referees of the Review of Agrarian Studies. Nandini Jayakumar helped with reading some of the unit-level NSS data. I am thankful to all of them. All views expressed here are the personal views of the author and do not reflect the views of the organisations with which he is affiliated.
Notes
1 Exactly same concepts are used for collection of data on land in the NSSO’s Surveys of Consumer Expenditure and NSSO’s Surveys of Employment and Unemployment.

2 See Cain (1983) and Rawal (2008), for a discussion of the problems of aggregating homestead land with agricultural land. While there is the possibility of separating different types of land from the data in the Land and Livestock Surveys, this is not possible from the data in the Consumer Expenditure Surveys and the Surveys on Employment and Unemployment.
3 As discussed in Rawal (2013), the decline in share of both categories of manual workers in the latest (68th round) data is on account of changes in the classification scheme.
4 For some households, information on primary occupation is either not recorded or is given a non-existent code. For some households that did not cultivate any land, self-employment in agriculture is reported as the primary occupation. The columns in Table 11 do not add up to 100 because such households could not be put into any category due to lack of correct information.
References
| Bakshi, Aparajita (2008), “Social Inequality in Land
Ownership in India: A Study with Particular Reference to West Bengal,” Social
Scientist, vol. 36, nos. 9–10, pp. 95–116.
|
|
| Cain, Mead (1983), “Landlessness in India and Bangladesh:
A Critical Review of National Data Sources,” Economic Development and
Cultural Change, vol. 32, no. 1, pp. 149–67.
|
|
| Ramachandran, V. K. (1980), “A Note on the Sources of
Official Data on Landholdings in Tamil Nadu,” Data Series No. 1, Madras
Institute of Development Studies, Chennai, December.
|
|
| Rawal, Vikas (2008), “Ownership Holdings of Land in Rural
India: Putting the Record Straight,” Economic and Political Weekly, vol.
43, no. 10, 8 March, pp. 43–47.
|
|
| Rawal, Vikas (2013), “On Identification of Rural Labour
Households in NSS Surveys,” mimeo.
|
Appendix A
On a Methodological Issue in Respect of Analysis of Changes in Land Distribution
A problem of working with data on the physical extent of land is that one ends up aggregating land that is of different quality and productive potential. This problem becomes particularly severe when one is dealing with data for a large geographical entity like India, which covers enormous diversity in terms of types of land. The range of physical extent of landholdings varies considerably across different parts of India, depending not only on differences in the inequality of land distribution, but also on differences in the productive potential of land and population density. As a result, the statistical distribution of landholdings in India as a whole not only reflects distribution across classes, but also regional differences in land structure. Changes that take place in a particular region may affect a particular segment of land distribution. If that happens, a regional phenomenon would show up as a distributional phenomenon when changes in land distribution are analysed.
This problem shows up quite clearly when one looks at changes in land distribution by dividing households in deciles or quintiles, and in analyses of Lorenz curves and Gini coefficients.
To take care of this problem, this paper defines quintiles of households at the level of the NSSO region within each State. In quintile-wise analysis, each quintile for India as a whole brings together households that belong to the corresponding quintile in each region. In other words, households in the top quintile in each region are put together as the top quintile households irrespective of their all-India ranking.
It may be noted that as a result of this normalisation in calculation of quintiles, some households in a higher quintile may have lower sizes of landholdings than some households in a lower quintile. This is a result only of differences in their location across NSSO regions and States.
While constructing Lorenz curves and computing Gini coefficients, we first calculate the proportional ranks of households within each region. We then create an all-India ranking putting landless households at the bottom and placing the rest of the households using their region-specific proportional ranks. Since there may be multiple households (from different regions) having the same region-level proportional ranks, these are then sub-ranked using physical extent of land.
To illustrate, in the first level of sorting, top households from each region are taken to the top of the all-India ranking. At the top end of the ranking, these households are then sorted by physical extent of land.
Once the households are ranked in this manner, I calculate the all-India cumulative proportion of households and all-India cumulative proportion of land, to plot Lorenz curves and calculate Gini coefficients.
There are two limitations of this method of normalisation. First, this method normalises the scale of landholdings only on the basis of proportional ranks and not on an economic basis. Secondly, comparing proportional ranks of households from States where landholdings of households at the top have been considerably reduced as a result of successful implementation of land reforms with proportional ranks of households in States where no land reforms have taken place can be particularly problematic. However, since this problem affects ranks of households in only three States – West Bengal, Kerala, and Tripura – the distortion caused by this in the all-India distribution of holdings is less than the distortion caused by simply pooling all the data.
As may be expected, this normalisation results in lowering the aggregate inequality at the all-India level as compared to a direct all-India calculation of Gini coefficient from pooled data. However, given that there is a great diversity in land structure across different regions in India, these normalised Gini coeffficients provide a more consistent approach to tracking changes in inequality over time.
Appendix B
State-level Estimates of Total Land Cultivated
Appendix Table B1 Extent of total land cultivated by households, by State, rural India, 1987–88 to 2011–12 in thousand hectares
| State | 1987–88 | 1993–94 | 1999–2000 | 2004–05 | 2009–10 | 2011–12 | NSA* |
| Andhra Pradesh | 8531 | 7891 | 7828 | 8320 | 6433 | 7785 | 11186 |
| Arunachal Pradesh | 269 | 139 | 162 | 167 | 225 | 210 | 213 |
| Assam | 2233 | 2401 | 1992 | 3502 | 3719 | 3187 | 2811 |
| Bihar (undivided) | 9417 | 8185 | 6388 | 8038 | 6347 | 7179 | 6344 |
| Madhya Pradesh (undivided) | 17748 | 17112 | 10042 | 16454 | 16941 | 15822 | 19816 |
| Goa | 0 | 31 | 13 | 26 | 80 | 4 | 131 |
| Gujarat | 5618 | 5949 | 3806 | 5769 | 5837 | 5675 | 10302 |
| Haryana | 4173 | 2999 | 4625 | 2505 | 2776 | 2664 | 3518 |
| Himachal Pradesh | 529 | 502 | 416 | 469 | 445 | 342 | 539 |
| Jammu & Kashmir | 688 | 286 | 738 | 467 | 488 | 512 | 732 |
| Karnataka | 7303 | 7028 | 7036 | 6569 | 5669 | 7612 | 10523 |
| Kerala | 1165 | 354 | 889 | 1051 | 876 | 652 | 2072 |
| Maharashtra | 13120 | 11664 | 14796 | 11228 | 11473 | 10993 | 17406 |
| Manipur | 153 | 137 | 1064 | 161 | 170 | 179 | 348 |
| Meghalaya | 217 | 144 | 223 | 339 | 150 | 190 | 284 |
| Mizoram | 62 | 94 | 49 | 55 | 49 | 53 | 130 |
| Nagaland | 0 | 127 | 119 | 111 | 121 | 203 | 362 |
| Orissa | 3539 | 4105 | 3221 | 3691 | 3894 | 3826 | 4682 |
| Punjab | 3255 | 3028 | 2485 | 2349 | 2391 | 2104 | 4158 |
| Rajasthan | 12776 | 14129 | 12522 | 12421 | 13734 | 12828 | 18349 |
| Sikkim | 49 | 45 | 46 | 36 | 37 | 52 | 77 |
| Tamil Nadu | 3577 | 3155 | 2551 | 2333 | 1983 | 1952 | 4954 |
| Tripura | 117 | 236 | 103 | 137 | 115 | 122 | 256 |
| Uttar Pradesh (undivided) | 17836 | 16972 | 13713 | 15428 | 14815 | 13865 | 17316 |
| West Bengal | 3916 | 3751 | 4682 | 3328 | 2102 | 2274 | 4991 |
Notes: NSA = net sown area for 2010–11, the latest year for which data are available from the land use statistics.
Appendix C
Quintile-wise distribution of land cultivated by households, by State
Appendix Table C1 Distribution of land cultivated by households across quintiles of households, by normalised quintiles of households defined at the level of NSSO region within each State, by State, 1987–88 to 2009–10 in per cent
| Quintiles of households | 1987–88 | 1993–94 | 1999–2000 | 2004–05 | 2009–10 | 2011–12 |
| Andhra Pradesh | ||||||
| Q1 | 0 | 0 | 0 | 0 | 0 | 0 |
| Q2 | 0 | 0 | 0 | 0 | 0 | 0 |
| Q3 | 6 | 4 | 4 | 1 | 1 | 2 |
| Q4 | 19 | 20 | 20 | 17 | 13 | 19 |
| Q5 | 74 | 76 | 77 | 82 | 86 | 79 |
| Assam | ||||||
| Q1 | 0 | 0 | 0 | 0 | 0 | 0 |
| Q2 | 0 | 0 | 0 | 0 | 0 | 0 |
| Q3 | 14 | 13 | 9 | 15 | 12 | 7 |
| Q4 | 25 | 28 | 27 | 28 | 31 | 28 |
| Q5 | 60 | 59 | 64 | 57 | 57 | 65 |
| Bihar (undivided) | ||||||
| Q1 | 0 | 0 | 0 | 0 | 0 | 0 |
| Q2 | 1 | 0 | 0 | 0 | 0 | 0 |
| Q3 | 7 | 7 | 5 | 6 | 2 | 1 |
| Q4 | 19 | 21 | 21 | 23 | 18 | 16 |
| Q5 | 73 | 72 | 74 | 71 | 80 | 83 |
| Madhya Pradesh (undivided) | ||||||
| Q1 | 0 | 0 | 0 | 0 | 0 | 0 |
| Q2 | 1 | 0 | 0 | 0 | 0 | 0 |
| Q3 | 12 | 14 | 12 | 11 | 10 | 9 |
| Q4 | 22 | 24 | 23 | 25 | 25 | 26 |
| Q5 | 64 | 62 | 65 | 64 | 65 | 65 |
| Goa | ||||||
| Q1 | 0 | 0 | 0 | 0 | 0 | 0 |
| Q2 | 0 | 0 | 0 | 0 | 0 | 0 |
| Q3 | 0 | 0 | 0 | 0 | 0 | 0 |
| Q4 | 0 | 13 | 7 | 2 | 7 | 0 |
| Q5 | 0 | 87 | 93 | 98 | 93 | 100 |
| Gujarat | ||||||
| Q1 | 0 | 0 | 0 | 0 | 0 | 0 |
| Q2 | 0 | 0 | 0 | 0 | 0 | 0 |
| Q3 | 6 | 4 | 4 | 2 | 3 | 3 |
| Q4 | 22 | 21 | 19 | 23 | 21 | 22 |
| Q5 | 72 | 74 | 77 | 74 | 76 | 75 |
| Haryana | ||||||
| Q1 | 0 | 0 | 0 | 0 | 0 | 0 |
| Q2 | 0 | 0 | 0 | 0 | 0 | 0 |
| Q3 | 6 | 2 | 3 | 1 | 0 | 0 |
| Q4 | 20 | 20 | 22 | 17 | 20 | 22 |
| Q5 | 74 | 77 | 74 | 82 | 80 | 78 |
| Himachal Pradesh | ||||||
| Q1 | 0 | 0 | 0 | 0 | 0 | 0 |
| Q2 | 6 | 2 | 0 | 0 | 0 | 0 |
| Q3 | 16 | 19 | 18 | 18 | 16 | 15 |
| Q4 | 21 | 23 | 23 | 25 | 25 | 26 |
| Q5 | 57 | 57 | 59 | 57 | 59 | 59 |
| Jammu & Kashmir | ||||||
| Q1 | 0 | 0 | 0 | 0 | 0 | 0 |
| Q2 | 5 | 2 | 0 | 0 | 0 | 0 |
| Q3 | 16 | 21 | 25 | 22 | 20 | 15 |
| Q4 | 24 | 26 | 27 | 25 | 28 | 28 |
| Q5 | 55 | 52 | 48 | 52 | 52 | 57 |
| Karnataka | ||||||
| Q1 | 0 | 0 | 0 | 0 | 0 | 0 |
| Q2 | 0 | 0 | 0 | 0 | 0 | 0 |
| Q3 | 8 | 8 | 7 | 4 | 2 | 3 |
| Q4 | 21 | 22 | 23 | 23 | 22 | 23 |
| Q5 | 71 | 70 | 70 | 73 | 76 | 73 |
| Kerala | ||||||
| Q1 | 0 | 0 | 0 | 0 | 0 | 0 |
| Q2 | 1 | 0 | 0 | 0 | 0 | 0 |
| Q3 | 6 | 0 | 3 | 3 | 1 | 1 |
| Q4 | 17 | 5 | 14 | 16 | 11 | 11 |
| Q5 | 76 | 95 | 83 | 81 | 87 | 87 |
| Maharashtra | ||||||
| Q1 | 0 | 0 | 0 | 0 | 0 | 0 |
| Q2 | 0 | 0 | 0 | 0 | 0 | 0 |
| Q3 | 8 | 6 | 7 | 4 | 3 | 2 |
| Q4 | 22 | 22 | 22 | 23 | 25 | 26 |
| Q5 | 69 | 71 | 71 | 73 | 72 | 72 |
| Manipur | ||||||
| Q1 | 0 | 0 | 0 | 0 | 0 | 0 |
| Q2 | 6 | 3 | 0 | 0 | 0 | 0 |
| Q3 | 19 | 20 | 10 | 24 | 14 | 13 |
| Q4 | 22 | 24 | 24 | 27 | 29 | 30 |
| Q5 | 52 | 53 | 66 | 49 | 57 | 58 |
| Meghalaya | ||||||
| Q1 | 0 | 0 | 0 | 0 | 0 | 0 |
| Q2 | 3 | 1 | 0 | 0 | 0 | 0 |
| Q3 | 17 | 23 | 23 | 17 | 2 | 10 |
| Q4 | 21 | 27 | 26 | 22 | 19 | 28 |
| Q5 | 59 | 49 | 51 | 61 | 79 | 62 |
| Mizoram | ||||||
| Q1 | 0 | 0 | 0 | 0 | 0 | 0 |
| Q2 | 7 | 7 | 0 | 0 | 0 | 0 |
| Q3 | 23 | 26 | 32 | 27 | 22 | 22 |
| Q4 | 24 | 27 | 25 | 28 | 31 | 32 |
| Q5 | 46 | 40 | 42 | 45 | 47 | 46 |
| Nagaland | ||||||
| Q1 | 0 | 0 | 0 | 0 | 0 | 0 |
| Q2 | 0 | 6 | 0 | 0 | 0 | 0 |
| Q3 | 0 | 23 | 31 | 25 | 21 | 18 |
| Q4 | 0 | 19 | 26 | 26 | 29 | 30 |
| Q5 | 0 | 51 | 43 | 49 | 50 | 52 |
| Orissa | ||||||
| Q1 | 0 | 0 | 0 | 0 | 0 | 0 |
| Q2 | 0 | 0 | 0 | 0 | 0 | 0 |
| Q3 | 10 | 10 | 8 | 7 | 7 | 6 |
| Q4 | 24 | 25 | 23 | 26 | 29 | 28 |
| Q5 | 66 | 65 | 69 | 68 | 64 | 66 |
| Punjab | ||||||
| Q1 | 0 | 0 | 0 | 0 | 0 | 0 |
| Q2 | 0 | 0 | 0 | 0 | 0 | 0 |
| Q3 | 0 | 0 | 0 | 0 | 0 | 0 |
| Q4 | 18 | 14 | 14 | 10 | 9 | 5 |
| Q5 | 82 | 86 | 86 | 90 | 91 | 95 |
| Rajasthan | ||||||
| Q1 | 0 | 0 | 0 | 0 | 0 | 0 |
| Q2 | 2 | 0 | 0 | 0 | 0 | 0 |
| Q3 | 13 | 15 | 15 | 13 | 10 | 10 |
| Q4 | 23 | 23 | 24 | 26 | 26 | 27 |
| Q5 | 62 | 61 | 61 | 62 | 63 | 62 |
| Sikkim | ||||||
| Q1 | 0 | 0 | 0 | 0 | 0 | 0 |
| Q2 | 5 | 0 | 0 | 0 | 0 | 0 |
| Q3 | 18 | 14 | 11 | 7 | 8 | 22 |
| Q4 | 25 | 26 | 25 | 28 | 31 | 30 |
| Q5 | 51 | 60 | 63 | 65 | 61 | 48 |
| Tamil Nadu | ||||||
| Q1 | 0 | 0 | 0 | 0 | 0 | 0 |
| Q2 | 0 | 0 | 0 | 0 | 0 | 0 |
| Q3 | 1 | 0 | 0 | 0 | 0 | 0 |
| Q4 | 16 | 14 | 9 | 7 | 4 | 1 |
| Q5 | 84 | 86 | 91 | 93 | 96 | 99 |
| Tripura | ||||||
| Q1 | 0 | 0 | 0 | 0 | 0 | 0 |
| Q2 | 0 | 0 | 0 | 0 | 0 | 0 |
| Q3 | 0 | 2 | 0 | 1 | 0 | 0 |
| Q4 | 19 | 21 | 23 | 24 | 22 | 19 |
| Q5 | 81 | 77 | 76 | 75 | 78 | 81 |
| Uttar Pradesh (undivided) | ||||||
| Q1 | 0 | 0 | 0 | 0 | 0 | 0 |
| Q2 | 2 | 0 | 0 | 0 | 0 | 0 |
| Q3 | 12 | 13 | 11 | 11 | 7 | 7 |
| Q4 | 22 | 23 | 22 | 24 | 25 | 24 |
| Q5 | 64 | 63 | 67 | 66 | 68 | 68 |
| West Bengal | ||||||
| Q1 | 0 | 0 | 0 | 0 | 0 | 0 |
| Q2 | 0 | 0 | 0 | 0 | 0 | 0 |
| Q3 | 6 | 6 | 7 | 4 | 1 | 1 |
| Q4 | 22 | 22 | 21 | 22 | 12 | 11 |
| Q5 | 72 | 72 | 72 | 74 | 87 | 88 |
Appendix D
Distribution across size-classes of land cultivated by households, by State
Appendix Table D1 Proportion of households in different size-classes of land cultivated by households, by State, 1987–88 to 2011–12 in per cent
| Size category | 1987–88 | 1993–94 | 1999–2000 | 2004–05 | 2009–10 | 2011–12 |
| Andhra Pradesh | ||||||
| Landless | 46 | 49 | 52 | 61 | 66 | 61 |
| <=1 ha | 30 | 30 | 30 | 19 | 20 | 20 |
| 1–2 ha | 12 | 12 | 11 | 10 | 7 | 12 |
| 2–4 ha | 7 | 6 | 5 | 6 | 5 | 5 |
| 4–10 ha | 4 | 2 | 2 | 3 | 1 | 1 |
| >10 ha | 1 | 0 | 0 | 0 | 0 | 0 |
| Assam | ||||||
| Landless | 31 | 29 | 36 | 26 | 27 | 38 |
| <=1 ha | 41 | 46 | 46 | 44 | 45 | 41 |
| 1–2 ha | 20 | 19 | 14 | 21 | 19 | 15 |
| 2–4 ha | 7 | 5 | 4 | 8 | 8 | 4 |
| 4–10 ha | 2 | 1 | 1 | 1 | 1 | 1 |
| >10 ha | 0 | 0 | 0 | 0 | 0 | 0 |
| Bihar | ||||||
| Landless | 35 | 37 | 42 | 42 | 49 | 46 |
| <=1 ha | 43 | 43 | 46 | 44 | 42 | 42 |
| 1–2 ha | 13 | 13 | 9 | 10 | 6 | 8 |
| 2–4 ha | 6 | 5 | 3 | 4 | 3 | 3 |
| 4–10 ha | 2 | 1 | 1 | 1 | 1 | 1 |
| >10 ha | 0 | 0 | 0 | 0 | 0 | 0 |
| Madhya Pradesh | ||||||
| Landless | 26 | 25 | 27 | 32 | 32 | 38 |
| <=1 ha | 24 | 25 | 35 | 27 | 32 | 26 |
| 1–2 ha | 19 | 22 | 20 | 19 | 16 | 18 |
| 2–4 ha | 18 | 18 | 12 | 16 | 13 | 13 |
| 4–10 ha | 11 | 9 | 5 | 6 | 5 | 4 |
| >10 ha | 3 | 2 | 1 | 1 | 1 | 1 |
| Goa | ||||||
| Landless | 0 | 60 | 69 | 73 | 68 | 95 |
| <=1 ha | 0 | 34 | 30 | 23 | 26 | 4 |
| 1–2 ha | 0 | 4 | 1 | 4 | 4 | 0 |
| 2–4 ha | 0 | 2 | 0 | 0 | 1 | 0 |
| 4–10 ha | 0 | 0 | 0 | 0 | 2 | 0 |
| Gujarat | ||||||
| Landless | 47 | 46 | 43 | 52 | 45 | 53 |
| <=1 ha | 23 | 25 | 35 | 23 | 32 | 24 |
| 1–2 ha | 12 | 12 | 12 | 12 | 10 | 12 |
| 2–4 ha | 10 | 10 | 6 | 9 | 8 | 7 |
| 4–10 ha | 7 | 6 | 4 | 5 | 5 | 4 |
| >10 ha | 1 | 1 | 1 | 1 | 1 | 1 |
| Haryana | ||||||
| Landless | 46 | 52 | 49 | 59 | 60 | 60 |
| <=1 ha | 12 | 15 | 18 | 16 | 12 | 13 |
| 1–2 ha | 12 | 13 | 12 | 10 | 12 | 12 |
| 2–4 ha | 13 | 12 | 12 | 9 | 10 | 11 |
| 4–10 ha | 13 | 7 | 7 | 5 | 5 | 4 |
| >10 ha | 4 | 2 | 1 | 1 | 1 | 0 |
| Himachal Pradesh | ||||||
| Landless | 11 | 13 | 17 | 20 | 18 | 21 |
| <=1 ha | 74 | 74 | 75 | 73 | 76 | 75 |
| 1–2 ha | 11 | 10 | 5 | 6 | 4 | 3 |
| 2–4 ha | 3 | 2 | 2 | 1 | 1 | 1 |
| 4–10 ha | 1 | 1 | 0 | 0 | 0 | 0 |
| >10 ha | 0 | 0 | 0 | 0 | 0 | 0 |
| Jammu & Kashmir | ||||||
| Landless | 14 | 16 | 13 | 11 | 16 | 23 |
| <=1 ha | 63 | 51 | 67 | 78 | 77 | 72 |
| 1–2 ha | 17 | 24 | 16 | 9 | 6 | 4 |
| 2–4 ha | 5 | 8 | 3 | 2 | 1 | 1 |
| 4–10 ha | 1 | 1 | 0 | 0 | 0 | 0 |
| >10 ha | 0 | 0 | 0 | 0 | 0 | 0 |
| Karnataka | ||||||
| Landless | 40 | 38 | 42 | 46 | 53 | 48 |
| <=1 ha | 26 | 29 | 29 | 26 | 23 | 24 |
| 1–2 ha | 16 | 16 | 16 | 13 | 12 | 13 |
| 2–4 ha | 10 | 10 | 9 | 9 | 8 | 9 |
| 4–10 ha | 6 | 6 | 4 | 4 | 3 | 5 |
| >10 ha | 2 | 1 | 1 | 1 | 1 | 1 |
| Kerala | ||||||
| Landless | 20 | 69 | 36 | 40 | 46 | 53 |
| <=1 ha | 73 | 29 | 60 | 55 | 51 | 45 |
| 1–2 ha | 5 | 1 | 3 | 3 | 3 | 2 |
| 2–4 ha | 1 | 0 | 1 | 1 | 1 | 0 |
| 4–10 ha | 0 | 0 | 0 | 0 | 0 | 0 |
| >10 ha | 0 | 0 | 0 | 0 | 0 | 0 |
| Maharashtra | ||||||
| Landless | 39 | 43 | 43 | 48 | 48 | 50 |
| <=1 ha | 23 | 24 | 28 | 24 | 24 | 23 |
| 1–2 ha | 17 | 15 | 15 | 14 | 12 | 14 |
| 2–4 ha | 12 | 10 | 10 | 9 | 12 | 9 |
| 4–10 ha | 8 | 6 | 4 | 4 | 4 | 4 |
| >10 ha | 2 | 1 | 1 | 1 | 1 | 0 |
| Manipur | ||||||
| Landless | 16 | 22 | 34 | 17 | 26 | 30 |
| <=1 ha | 58 | 62 | 37 | 67 | 59 | 55 |
| 1–2 ha | 18 | 12 | 17 | 14 | 12 | 12 |
| 2–4 ha | 6 | 4 | 8 | 1 | 2 | 3 |
| 4–10 ha | 2 | 1 | 3 | 0 | 1 | 1 |
| >10 ha | 0 | 0 | 0 | 0 | 0 | 0 |
| Meghalaya | ||||||
| Landless | 18 | 17 | 12 | 16 | 37 | 26 |
| <=1 ha | 55 | 74 | 62 | 58 | 53 | 59 |
| 1–2 ha | 18 | 8 | 20 | 14 | 8 | 10 |
| 2–4 ha | 7 | 1 | 6 | 9 | 2 | 4 |
| 4–10 ha | 2 | 0 | 0 | 3 | 1 | 0 |
| >10 ha | 0 | 0 | 0 | 0 | 0 | 0 |
| Mizoram | ||||||
| Landless | 17 | 5 | 14 | 13 | 22 | 24 |
| <=1 ha | 42 | 43 | 60 | 70 | 68 | 69 |
| 1–2 ha | 33 | 36 | 22 | 15 | 9 | 5 |
| 2–4 ha | 7 | 15 | 4 | 2 | 1 | 1 |
| 4–10 ha | 1 | 1 | 0 | 0 | 0 | 0 |
| >10 ha | 0 | 0 | 0 | 0 | 0 | 0 |
| Nagaland | ||||||
| Landless | 0 | 4 | 11 | 9 | 14 | 8 |
| <=1 ha | 0 | 36 | 35 | 57 | 60 | 46 |
| 1–2 ha | 0 | 46 | 38 | 25 | 22 | 22 |
| 2–4 ha | 0 | 13 | 16 | 8 | 3 | 20 |
| 4–10 ha | 0 | 1 | 0 | 1 | 1 | 3 |
| >10 ha | 0 | 1 | 0 | 0 | 0 | 0 |
| Orissa | ||||||
| Landless | 36 | 35 | 38 | 42 | 38 | 41 |
| <=1 ha | 42 | 42 | 47 | 40 | 44 | 42 |
| 1–2 ha | 15 | 16 | 10 | 14 | 13 | 12 |
| 2–4 ha | 6 | 6 | 4 | 4 | 4 | 4 |
| 4–10 ha | 2 | 1 | 1 | 1 | 0 | 1 |
| >10 ha | 0 | 0 | 0 | 0 | 0 | 0 |
| Punjab | ||||||
| Landless | 57 | 62 | 61 | 68 | 68 | 74 |
| <=1 ha | 12 | 11 | 16 | 10 | 11 | 7 |
| 1–2 ha | 11 | 10 | 10 | 8 | 8 | 9 |
| 2–4 ha | 10 | 8 | 8 | 9 | 8 | 6 |
| 4–10 ha | 8 | 7 | 5 | 4 | 4 | 4 |
| >10 ha | 2 | 2 | 1 | 1 | 1 | 1 |
| Rajasthan | ||||||
| Landless | 22 | 19 | 22 | 26 | 30 | 29 |
| <=1 ha | 29 | 30 | 35 | 34 | 29 | 33 |
| 1–2 ha | 18 | 18 | 15 | 16 | 16 | 15 |
| 2–4 ha | 14 | 16 | 14 | 14 | 14 | 13 |
| 4–10 ha | 14 | 14 | 11 | 9 | 8 | 8 |
| >10 ha | 4 | 4 | 2 | 1 | 2 | 1 |
| Sikkim | ||||||
| Landless | 15 | 32 | 35 | 44 | 42 | 22 |
| <=1 ha | 47 | 46 | 46 | 49 | 54 | 68 |
| 1–2 ha | 25 | 16 | 15 | 6 | 3 | 8 |
| 2–4 ha | 12 | 4 | 3 | 1 | 1 | 1 |
| 4–10 ha | 2 | 1 | 1 | 0 | 0 | 0 |
| >10 ha | 0 | 0 | 0 | 0 | 0 | 0 |
| Tamil Nadu | ||||||
| Landless | 57 | 63 | 67 | 72 | 77 | 79 |
| <=1 ha | 30 | 26 | 25 | 21 | 16 | 15 |
| 1–2 ha | 8 | 7 | 5 | 5 | 5 | 4 |
| 2–4 ha | 4 | 2 | 2 | 2 | 2 | 1 |
| 4–10 ha | 1 | 1 | 1 | 1 | 0 | 0 |
| >10 ha | 0 | 0 | 0 | 0 | 0 | 0 |
| Tripura | ||||||
| Landless | 59 | 52 | 58 | 55 | 63 | 62 |
| <=1 ha | 34 | 34 | 40 | 42 | 36 | 35 |
| 1–2 ha | 5 | 8 | 2 | 3 | 0 | 2 |
| 2–4 ha | 1 | 4 | 0 | 0 | 0 | 0 |
| 4–10 ha | 0 | 1 | 0 | 0 | 0 | 0 |
| >10 ha | 0 | 0 | 0 | 0 | 0 | 0 |
| Uttar Pradesh | ||||||
| Landless | 23 | 23 | 26 | 29 | 33 | 35 |
| <=1 ha | 48 | 51 | 56 | 53 | 51 | 50 |
| 1–2 ha | 16 | 15 | 12 | 12 | 10 | 10 |
| 2–4 ha | 9 | 8 | 5 | 5 | 4 | 4 |
| 4–10 ha | 4 | 2 | 1 | 1 | 1 | 1 |
| >10 ha | 0 | 0 | 0 | 0 | 0 | 0 |
| West Bengal | ||||||
| Landless | 40 | 42 | 48 | 48 | 62 | 65 |
| <=1 ha | 46 | 48 | 42 | 46 | 35 | 32 |
| 1–2 ha | 10 | 8 | 6 | 5 | 2 | 2 |
| 2–4 ha | 4 | 2 | 3 | 1 | 0 | 1 |
| 4–10 ha | 1 | 0 | 1 | 0 | 0 | 0 |
| >10 ha | 0 | 0 | 0 | 0 | 0 | 0 |
Appendix Table D2 Share of land cultivated by households in different size-classes of households, by State, 1987–88 to 2011–12 in per cent
| Size category | 1987–88 | 1993–94 | 1999–2000 | 2004–05 | 2009–10 | 2011–12 |
| Andhra Pradesh | ||||||
| Landless | 0 | 0 | 0 | 0 | 0 | 0 |
| <=1 ha | 18 | 20 | 23 | 16 | 23 | 20 |
| 1–2 ha | 21 | 26 | 27 | 24 | 25 | 33 |
| 2–4 ha | 24 | 25 | 25 | 28 | 31 | 24 |
| 4–10 ha | 26 | 20 | 17 | 27 | 16 | 12 |
| >10 ha | 12 | 10 | 9 | 5 | 4 | 10 |
| Assam | ||||||
| Landless | 0 | 0 | 0 | 0 | 0 | 0 |
| <=1 ha | 28 | 33 | 39 | 28 | 29 | 32 |
| 1–2 ha | 36 | 40 | 37 | 39 | 37 | 35 |
| 2–4 ha | 24 | 20 | 17 | 26 | 29 | 18 |
| 4–10 ha | 12 | 6 | 5 | 7 | 5 | 11 |
| >10 ha | 1 | 0 | 1 | 0 | 0 | 4 |
| Bihar | ||||||
| Landless | 0 | 0 | 0 | 0 | 0 | 0 |
| <=1 ha | 24 | 28 | 41 | 39 | 40 | 33 |
| 1–2 ha | 24 | 30 | 29 | 29 | 25 | 34 |
| 2–4 ha | 23 | 20 | 16 | 20 | 21 | 21 |
| 4–10 ha | 19 | 13 | 12 | 11 | 13 | 11 |
| >10 ha | 10 | 9 | 2 | 1 | 1 | 2 |
| Madhya Pradesh | ||||||
| Landless | 0 | 0 | 0 | 0 | 0 | 0 |
| <=1 ha | 7 | 8 | 15 | 12 | 15 | 14 |
| 1–2 ha | 14 | 19 | 24 | 21 | 19 | 24 |
| 2–4 ha | 25 | 28 | 26 | 32 | 30 | 31 |
| 4–10 ha | 32 | 31 | 25 | 26 | 27 | 23 |
| >10 ha | 21 | 14 | 11 | 10 | 9 | 9 |
| Goa | ||||||
| Landless | 0 | 0 | 0 | 0 | 0 | 0 |
| <=1 ha | 0 | 47 | 83 | 57 | 43 | 17 |
| 1–2 ha | 0 | 30 | 17 | 27 | 16 | 26 |
| 2–4 ha | 0 | 20 | 0 | 5 | 11 | 3 |
| 4–10 ha | 0 | 2 | 0 | 11 | 30 | 54 |
| Gujarat | ||||||
| Landless | 0 | 0 | 0 | 0 | 0 | 0 |
| <=1 ha | 11 | 12 | 19 | 13 | 18 | 15 |
| 1–2 ha | 14 | 16 | 21 | 19 | 17 | 22 |
| 2–4 ha | 24 | 26 | 22 | 27 | 27 | 25 |
| 4–10 ha | 36 | 30 | 29 | 30 | 29 | 27 |
| >10 ha | 16 | 17 | 8 | 10 | 10 | 11 |
| Haryana | ||||||
| Landless | 0 | 0 | 0 | 0 | 0 | 0 |
| <=1 ha | 4 | 7 | 7 | 10 | 7 | 9 |
| 1–2 ha | 9 | 15 | 15 | 17 | 20 | 23 |
| 2–4 ha | 19 | 26 | 30 | 31 | 31 | 36 |
| 4–10 ha | 37 | 34 | 35 | 33 | 28 | 27 |
| >10 ha | 30 | 18 | 13 | 9 | 14 | 5 |
| Himachal Pradesh | ||||||
| Landless | 0 | 0 | 0 | 0 | 0 | 0 |
| <=1 ha | 51 | 55 | 67 | 68 | 68 | 79 |
| 1–2 ha | 26 | 26 | 18 | 21 | 17 | 15 |
| 2–4 ha | 15 | 12 | 11 | 9 | 12 | 5 |
| 4–10 ha | 7 | 7 | 3 | 2 | 3 | 1 |
| >10 ha | 0 | 1 | 0 | 0 | 0 | 0 |
| Jammu & Kashmir | ||||||
| Landless | 0 | 0 | 0 | 0 | 0 | 0 |
| <=1 ha | 40 | 31 | 51 | 60 | 71 | 74 |
| 1–2 ha | 32 | 39 | 36 | 25 | 20 | 17 |
| 2–4 ha | 19 | 26 | 13 | 12 | 7 | 6 |
| 4–10 ha | 6 | 4 | 1 | 2 | 2 | 3 |
| >10 ha | 4 | 0 | 0 | 0 | 0 | 1 |
| Karnataka | ||||||
| Landless | 0 | 0 | 0 | 0 | 0 | 0 |
| <=1 ha | 10 | 13 | 15 | 15 | 17 | 13 |
| 1–2 ha | 17 | 20 | 24 | 21 | 24 | 19 |
| 2–4 ha | 22 | 24 | 26 | 27 | 29 | 26 |
| 4–10 ha | 28 | 29 | 21 | 25 | 19 | 29 |
| >10 ha | 23 | 14 | 12 | 12 | 11 | 12 |
| Kerala | ||||||
| Landless | 0 | 0 | 0 | 0 | 0 | 1 |
| <=1 ha | 52 | 67 | 56 | 61 | 59 | 67 |
| 1–2 ha | 25 | 13 | 21 | 21 | 27 | 18 |
| 2–4 ha | 13 | 11 | 11 | 14 | 8 | 9 |
| 4–10 ha | 9 | 9 | 8 | 3 | 4 | 2 |
| >10 ha | 1 | 0 | 5 | 1 | 2 | 4 |
| Maharashtra | ||||||
| Landless | 0 | 0 | 0 | 0 | 0 | 0 |
| <=1 ha | 8 | 11 | 13 | 13 | 12 | 15 |
| 1–2 ha | 17 | 19 | 22 | 22 | 19 | 24 |
| 2–4 ha | 23 | 25 | 27 | 28 | 34 | 28 |
| 4–10 ha | 33 | 29 | 24 | 27 | 24 | 28 |
| >10 ha | 18 | 15 | 14 | 10 | 11 | 5 |
| Manipur | ||||||
| Landless | 0 | 0 | 0 | 0 | 0 | 0 |
| <=1 ha | 40 | 53 | 21 | 58 | 51 | 49 |
| 1–2 ha | 29 | 27 | 30 | 33 | 29 | 29 |
| 2–4 ha | 18 | 15 | 28 | 6 | 9 | 15 |
| 4–10 ha | 11 | 6 | 19 | 2 | 10 | 7 |
| >10 ha | 2 | 0 | 3 | 1 | 1 | 0 |
| Meghalaya | ||||||
| Landless | 0 | 0 | 0 | 0 | 0 | 0 |
| <=1 ha | 33 | 71 | 40 | 32 | 39 | 49 |
| 1–2 ha | 29 | 22 | 39 | 22 | 31 | 29 |
| 2–4 ha | 20 | 5 | 19 | 27 | 16 | 22 |
| 4–10 ha | 14 | 2 | 2 | 18 | 14 | 1 |
| >10 ha | 3 | 0 | 0 | 0 | 0 | 0 |
| Mizoram | ||||||
| Landless | 0 | 0 | 0 | 0 | 0 | 0 |
| <=1 ha | 30 | 24 | 49 | 59 | 69 | 78 |
| 1–2 ha | 46 | 43 | 38 | 30 | 22 | 16 |
| 2–4 ha | 18 | 31 | 13 | 9 | 2 | 6 |
| 4–10 ha | 4 | 3 | 0 | 2 | 7 | 0 |
| >10 ha | 2 | 0 | 0 | 0 | 0 | 0 |
| Nagaland | ||||||
| Landless | 0 | 0 | 0 | 0 | 0 | 0 |
| <=1 ha | 0 | 15 | 18 | 32 | 41 | 17 |
| 1–2 ha | 0 | 41 | 46 | 40 | 42 | 25 |
| 2–4 ha | 0 | 20 | 35 | 23 | 11 | 45 |
| 4–10 ha | 0 | 2 | 2 | 4 | 6 | 13 |
| >10 ha | 0 | 22 | 0 | 1 | 0 | 0 |
| Orissa | ||||||
| Landless | 0 | 0 | 0 | 0 | 0 | 0 |
| <=1 ha | 29 | 30 | 40 | 35 | 39 | 38 |
| 1–2 ha | 32 | 34 | 28 | 35 | 35 | 33 |
| 2–4 ha | 24 | 23 | 22 | 19 | 19 | 20 |
| 4–10 ha | 13 | 11 | 8 | 9 | 5 | 8 |
| >10 ha | 2 | 2 | 1 | 2 | 2 | 0 |
| Punjab | ||||||
| Landless | 0 | 0 | 0 | 0 | 0 | 0 |
| <=1 ha | 5 | 5 | 9 | 7 | 7 | 5 |
| 1–2 ha | 12 | 13 | 18 | 16 | 15 | 21 |
| 2–4 ha | 23 | 21 | 25 | 32 | 29 | 24 |
| 4–10 ha | 38 | 35 | 34 | 34 | 34 | 35 |
| >10 ha | 22 | 25 | 15 | 12 | 14 | 15 |
| Rajasthan | ||||||
| Landless | 0 | 0 | 0 | 0 | 0 | 0 |
| <=1 ha | 7 | 7 | 9 | 11 | 11 | 11 |
| 1–2 ha | 11 | 11 | 12 | 15 | 16 | 16 |
| 2–4 ha | 18 | 19 | 21 | 27 | 26 | 28 |
| 4–10 ha | 36 | 34 | 37 | 34 | 30 | 34 |
| >10 ha | 28 | 28 | 20 | 14 | 17 | 10 |
| Sikkim | ||||||
| Landless | 0 | 0 | 0 | 0 | 0 | 0 |
| <=1 ha | 26 | 38 | 39 | 64 | 77 | 70 |
| 1–2 ha | 34 | 35 | 40 | 23 | 14 | 23 |
| 2–4 ha | 30 | 18 | 15 | 5 | 9 | 7 |
| 4–10 ha | 10 | 8 | 6 | 4 | 0 | 0 |
| >10 ha | 0 | 0 | 0 | 4 | 0 | 0 |
| Tamil Nadu | ||||||
| Landless | 0 | 0 | 0 | 0 | 0 | 0 |
| <=1 ha | 28 | 34 | 39 | 39 | 38 | 38 |
| 1–2 ha | 26 | 28 | 28 | 27 | 32 | 33 |
| 2–4 ha | 23 | 19 | 18 | 18 | 21 | 21 |
| 4–10 ha | 16 | 14 | 12 | 15 | 8 | 8 |
| >10 ha | 8 | 4 | 3 | 1 | 1 | 1 |
| Tripura | ||||||
| Landless | 0 | 0 | 0 | 0 | 0 | 0 |
| <=1 ha | 54 | 35 | 83 | 77 | 91 | 81 |
| 1–2 ha | 25 | 29 | 12 | 17 | 3 | 16 |
| 2–4 ha | 13 | 26 | 4 | 4 | 5 | 3 |
| 4–10 ha | 6 | 8 | 0 | 1 | 1 | 0 |
| >10 ha | 2 | 1 | 0 | 0 | 0 | 0 |
| Uttar Pradesh | ||||||
| Landless | 0 | 0 | 0 | 0 | 0 | 0 |
| <=1 ha | 22 | 27 | 36 | 35 | 38 | 39 |
| 1–2 ha | 24 | 26 | 26 | 26 | 26 | 28 |
| 2–4 ha | 26 | 27 | 23 | 22 | 22 | 20 |
| 4–10 ha | 22 | 17 | 13 | 13 | 11 | 11 |
| >10 ha | 6 | 3 | 3 | 4 | 4 | 2 |
| West Bengal | ||||||
| Landless | 0 | 0 | 0 | 0 | 0 | 0 |
| <=1 ha | 38 | 48 | 40 | 60 | 69 | 60 |
| 1–2 ha | 30 | 30 | 24 | 26 | 20 | 21 |
| 2–4 ha | 22 | 17 | 22 | 11 | 6 | 11 |
| 4–10 ha | 9 | 4 | 13 | 2 | 5 | 7 |
| >10 ha | 1 | 0 | 1 | 0 | 0 | 0 |